Important Technical Analysis Indicators
If you are an aspiring trader, perhaps in the world of stocks or Forex, something that you absolutely need to be familiar with are technical indicators.
These are special tools use in the methodology of technical analysis, and they are very useful for finding entry and exit points, for creating trading setups and so much more.
Today, we want to talk about what exactly technical analysis indicators are, how they are used, and what some of the most common ones are.
What is Technical Analysis?
When it comes to trading, such as in stocks or Forex, technical analysis is a specific analysis methodology that is used to forecast the direction of prices.
This analysis and prediction of prices is achieved through the study of prior market data, generally through the use of prices and trading volume.
Using technical analysis, a trader can predict trends, trend reversals, and price movements too. The reason why this is important is because a large part of this, the main part, is the technical analysis indicator, or simply known as the technical indicator.
What Are Technical Analysis Indicators?
To provide you with a basic definition, technical indicators are pattern based or heuristic signals that are produced by the price, volume, and open interest of a security, contract, currency pair, stock, or any other such tradable asset.
By analyzing a plethora of historical data, such as price and volume, traders can then predict future price movements.
Technical analysts use these indicators to not only predict future price movements but also to find the right trading setups for any given day. It’s all about analyzing technical analysis charts patterns to enter and exit trades. Of course, the main goal is to make a profit.
Types of Technical Indicators
Something that is important to know is that there are a few different types of technical analysis indicators out there, and they all tell you something else.
To be precise, there are 4 main types of technical indicators. These include s. Let’s take a closer look at each one so you know what you are getting into.
Volatility
Volatility technical analysis indicators are used to tell you how much a price has changed over a given period of time. Volatility is an extremely important aspect of the market.
Without volatility, there is no real way to make money through trading. The point here is that the price of anything has to move in order to make a profit when a trade is placed.
If there is no volatility or no price movement, then it is impossible to make a profit. The higher the volatility level is, the faster a price is changing, and the lower the volatility, the slower the price change is. Beware that volatility indicators tell you nothing about the direction of the price, just the price range.
Volume
Volume indicators are used to tell you how the volume in a given market is changing over a given period of time. In other words, how many units of something are being bought and/or sold over a given period of time.
For example, it can represent how much gold, silver, oil, or even how much of a currency is being traded in a specific time period.
This is very important because when the price of something changes, volume will indicate how strong that movement is. For instance, bullish moves on high volumes are more likely and easier to be maintained than bullish moves on low volume.
Momentum
Yet another important type of technical analysis indicator is the momentum indicator. This type of indicator will tell you how strong a trend is, as well as if a particular trend may reverse. These are very useful for picking out price tops and bottoms. There are various momentum indicators which we will take a closer look at, both today and in the coming weeks as well.
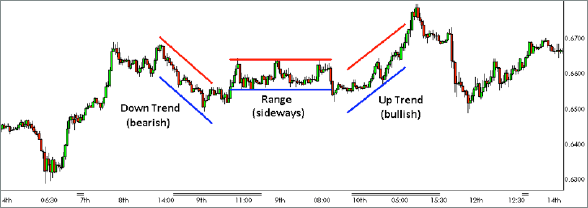
Trend
A trend indicator is used to tell you in which direction a market is moving in, that is if there is any trend at all. Trend indicators are sometimes referred to as oscillators, which is because they usually move between low and high values, like a wave that oscillates up and down.
Useful Technical Analysis Indicators
Let’s take a quick look at some technical analysis indicators. We want to cover at least one indicators from each of the four categories listed above.
Bollinger Bands
One of the indicators that you should be familiar with is the Bollinger Bands indicator. This is a chart indicator that consists of two lines or bands. These lines are two standard deviations above and below the 20 day moving average, which itself appears as a line between the two bands. If the bands are widening, it shows increased market volatility, whereas narrowing bands indicate decreased market volatility.
/BollingerBands-5c535dc646e0fb00013a1b8b.png)
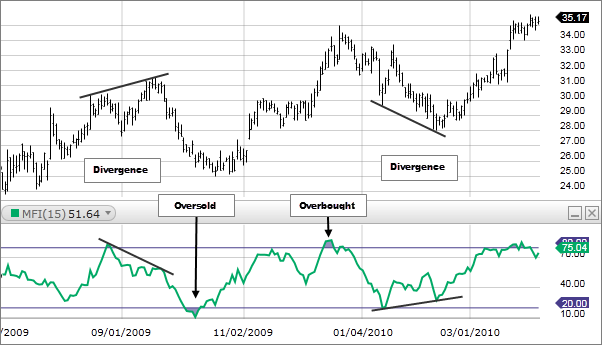
MFI
The money flow indicator is a technical indicator that indicates the rate at which money is invested into a security and then withdrawn from it. Both the construction and interpretation of the money flow index are similar to the RSI or relative strength index, with the main difference being that the MFI is all about trading volume.
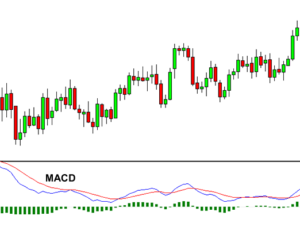
MACD
MACD or moving average convergence divergence is a momentum indicator. This is an interesting one because MACD consists of two components, moving averages which are turned into an oscillator by taking the longer average out of the shorter average. MACD indicates momentum because it oscillates between the moving averages as they converge, overlap, and diverge.
Moving Average
The moving average indicator, simply known as MA, is an indicator that can identify the direction of a price trend. This indicator uses price points over a specific time frame, divided by the number of data points to present a single trend line. This indicator can be used with a number of timeframes.
:max_bytes(150000):strip_icc()/SMA-5c535f2846e0fb00012b9825.png)
Technical Analysis Indicators – Final Thoughts
As you can see, there is a whole lot that goes into technical analysis, and technical analysis indicators are indeed very important to be familiar with. Stay tuned, because in the coming days and weeks we will be providing you with a lot more info on technical analysis and indicators too.
CLICK BELOW TO JOIN INCOME MENTOR BOX AND START MAKING REAL PROFITS!
