The Basics of Bollinger Bands
The Basics of Bollinger Bands
If you are just getting into the world of trading, weather stocks, forex, or anything in between, one of the most important things you need to know all about are indicators. Indicators are a special set of trading tools designed to provide you with a variety information about the price and the value of a specific security, currency, or more. There are four main types of indicators out there, and these include momentum, trend, volatility, and volume indicators. What we are here to do today is to take a closer look at one of the best volatility indicators out there, Bollinger bands.
when it comes to gathering as much information as possible about price data, Bollinger bands are extremely useful. Now, understanding exactly what Bollinger bands do and what they tell you is a bit complicated. However, this is what we are here to explain to you today. Today, we want to provide you with a crash course of Bollinger bands, and exactly how to use them. Below, we have included one video from Andrew, where he describes the four best trading strategies to use with Bollinger bands. If you master the basics of these Bollinger bands, and you also take a closer look at the strategies discussed by Andrew, your life as a trader should become much easier and more profitable too.
/dotdash_INV-final-Bollinger-Band-Definition-June-2021-01-518977e3031d405497003f1747a3c250.jpg)
What are Bollinger Bands?
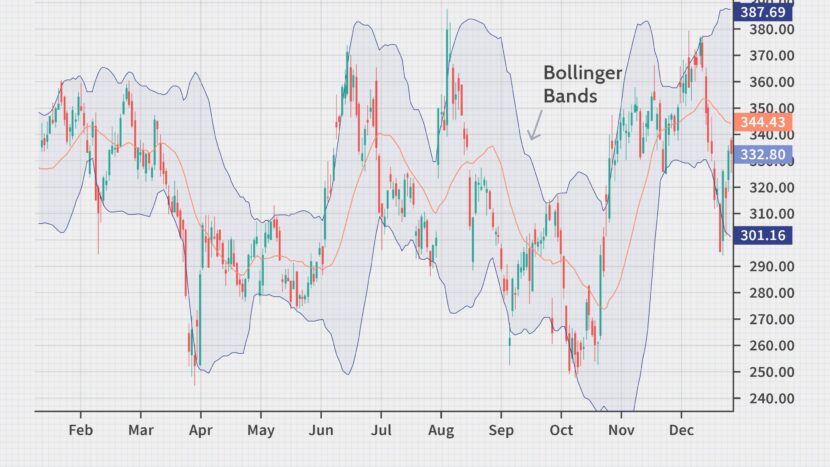
Alright, so first and foremost, Bollinger bands is a volatility indicator. A man named John Bollinger created the Bollinger bands in the 1980s, and he developed a special technique for using a moving average along with two trading bands above and below that moving average. Unlike a normal moving average that has a percentage population, the Bollinger band simply adds and subtracts a standard deviation calculation.
Keep in mind that standard deviation is a mathematical formula that measures volatility. This shows how the price of a currency or a stock can vary from its true value. By measuring the volatility of price, Bollinger bands have the ability to adjust themselves to market conditions. This is something that makes Bollinger bands extremely useful for a variety of traders, because you can find mostly all price data needed in between those two bands.
The Three Components of Bollinger Bands
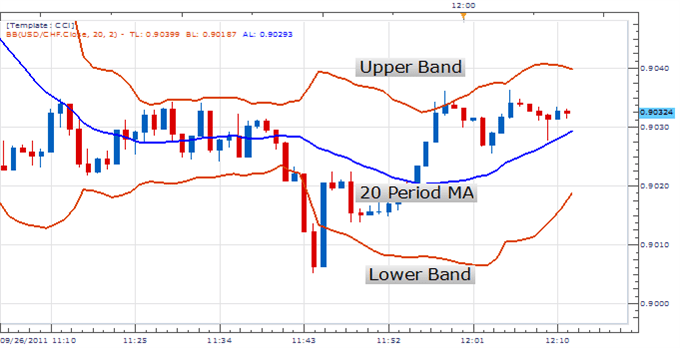
In order to be able to gather data about volatility, you first need to know what the three main components of the Bollinger bands are. Being able to gather data relies on your understanding of these three main components. The first of these main components is a simple moving average, usually of an intermediate length. This is a simple 20 day moving average and if this is often the default setting. This average can be used for measuring trend and to calculate the other two elements of this indicator.
The second part of this indicator is the upper band, which is a standard deviation above the simple moving average used in this indicator. Two standard deviations is usually the default that is used by most charting software. The third component of Bollinger bands is the lower band, and this is a standard deviation below the simple math moving average, and it is usually 2 standard deviations that is the default.
What They Tell You
Let’s provide you with a better understanding of exactly what the Bollinger band indicator tells you. Most traders believe that the closer the price moves to the upper band, the more overbought the market is, but the lower the price move to the lower band, the more oversold the market is. The main takeaway here is that the further away the bands are from each other, the higher the amount of volatility the market is seeing.
Pros & Cons of Bollinger Bands
Bollinger bands you have both advantages and disadvantages that you need to know about, so let’s take a quick look at these.
Pros
- When it comes down to it, this Bollinger bands are the best indicators out there for seeing volatility in a trending market.
- This is one of the most popular technical indicators out there due to its ease of use, it can be easily applied and they can help with identifying trends, volatility, and momentum.
- Bollinger bands are also great for identifying new and emerging trends at the end of old trends, which makes them an awesome multipurpose indicator.
Cons
- The only real downside with these Bollinger bands indicators is that they follow recent market movements, and this means that traders might not get signals until price movement is already underway. In other words this is a lagging indicator.
- Even John Bollinger himself said that this indicator is not completely foolproof, and it should be used in conjunction with other types of technical analysis.

Tips for Using Bollinger Bands
Let’s provide you with some of the most important tips that you need to know about these Bollinger bands indicators, especially when it comes to reading what they tell you.
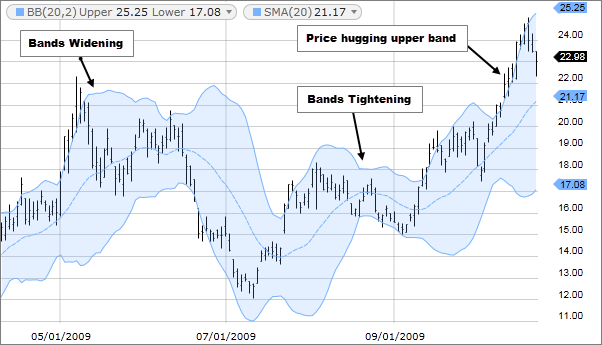
- when the bands get separated by a large amount, any existing trend may close due to rising volatility.
- When the bands tighten together in a time of low volatility, there is a higher probability of a sharp price move in either direction. This could start a trending move. What you also need to do here is to observe the false moves in the opposite directions, and these may reverse before the right trend starts.
- Keep in mind that the price can go beyond a band of envelope for long periods when there are strong trends.
- Keep in mind that the prices can bounce within the envelope bands, touching one man and then the other. These swings can be very useful for determining potential profit targets. For example, if the price bounces off the lower band and then passes about the moving average, the upper band then is the profit target.
- Keep in mind that you can expect a strong trend continuation if the price moves out of the bands, but if the price moves back inside the band right away, then the suggested strength is negated.
How to Trade with BB
We aren’t going to get into explaining exactly how to trade with the Bollinger bands indicator right now, but we what we do want to do is to provide you with this particular video. In the video that we have included here, Andrew discusses is before best trading strategies to use with this Bollinger bands indicator.
VISIT ANDREW’S TRADING CHANNEL
If you master any one of the trading strategies that Andrew discuss is in this video, your life as a forex or stock market trader should become much easier and more profitable to. If there is one thing that you take away from today’s article, it should be everything that Andrew discusses it within this video.
https://youtu.be/qO6I7MrCrgY
The Bottom Line on Bollinger Bands
Now that you know what Bollinger bands are, you got one more awesome indicator in your arsenal to evaluate price data, and therefore to place the best possible trades for the biggest profits.
If you need help day trading, and what you need is a comprehensive education, particularly on Forex trading, then the best place to be is the Income Mentor Box Day Trading Academy. At this time, the IMB Academy is the most comprehensive, user friendly, effective, and affordable Forex trading school out there.
CLICK BELOW TO JOIN INCOME MENTOR BOX AND START MAKING REAL PROFITS!