The Price Action Trading Guide
The Price Action Trading Guide
When it comes to trading, price action trading is extremely important for you to know. This type of technical analysis trading can be extremely beneficial in terms of making profits.
Sure, price action trading is about engulfing patterns and trading pin bars, but also about reading market sentiment, identifying areas of value, and trading using the path of least resistance. Moreover, price action trading is all about which indicators are the best ones to use.
What we are here to do today is to provide you with a great price action trading guide. We’ve got a myriad of price action trading tips for you to follow in order to be successful.
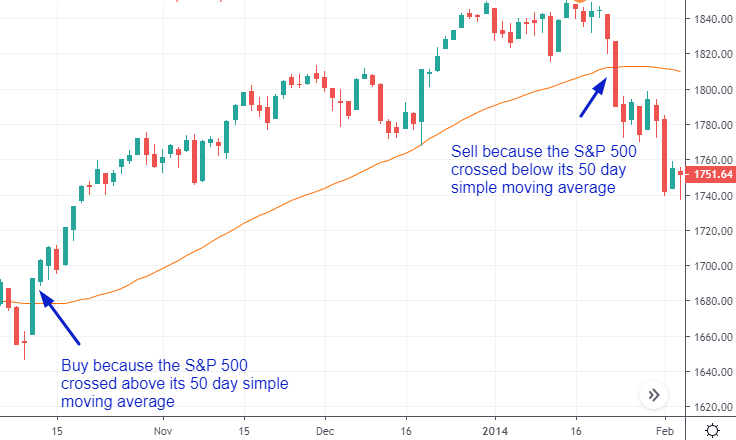
Don’t Stray from the Moving Average
What you need to know is that trending markets usually revert back towards the moving average. When a trend is very strong, the market tends to revert to the 20 moving average. When a trend is moderate, it reverts to the 100 moving average.
If a trend is weak, it will revert to a 200 moving average. The biggest mistake you can make is to start a trade when the market is moving up far away from the moving average.
Moreover, you need to know what the moving average is that is currently being respected by the markets. Keep in mind that when a market is trending strongly, the value of the moving average is lower, and in a weak trending market, the value of the moving average is higher.
Using Support and Resistance Matters
Next important tip when it comes to price action trading is that support and resistance goes a long way in helping you to identify areas of value that you can trade from. Of course, you want to sell high and buy low, but how do you identify what is high and what is low.
Well, support and resistance helps you do just this, because support is an area on the chart when you are looking to buy low, in resistance is an area when you are looking to sell high.
What you also need to pay attention to is dynamic support and resistance which is when support and resistance moves along with the price you usually get dynamic resistance in a downtrend and dynamic support in an uptrend.
You can use moving averages to identify these. Keep in mind that if a market is trending very strongly, a price may not pull back towards the horizontal support and resistance, but back towards dynamic support and resistance.
What is also important to note is that trading support and resistance gives you a very favorable risk to reward ratio. Support and resistance definitely matters in price action trading.
Keep in mind that when you enter a trade in the middle of a range, you never get a favorable risk to reward ratio. However, if you use support and resistance areas to enter trades, it greatly increases your risk to reward ratio.
Longer Ranges Mean Harder Trends
What you need to know here is that when a range expands, the market is sending you a clear signal that it will move in the direction of that expansion.
Traders all around the world can see one arrange is expanding, and many will queue up too short the resistance, while some will trade the breakout.
However, if the price trades above the resistance, shorts will get squeezed, and breakout traders will then hop on that same bandwagon. The point here is that you want to wait for a fairly long time to capture big market moves. This is one of the most important things that you need to know when it comes to price action trading.
Pay Attention to Narrow Range Candles
you now know that the longer a price range is the bigger the trend will be. You can now take this concept one step further and apply it to candle stick patterns. What you want to lookout for a narrow candle ranges.
When there are narrow range candles, you can expect big explosive movements to happen. This is why you always want to pay attention to narrow range candles, because they signify that a big move is about to happen.
https://www.youtube.com/watch?v=JrEe554aToQ
Pay Attention to Wide Range Candles Too
You do also want to pay attention to wide range candles, which are formed when there is an imbalance of selling and buying pressure. When you see wide range candles, it generally means that there is hidden support and resistance present. Just keep in mind that you don’t want to use wide range candles alone to trade, but in conjunction with other technical tools.
If You are Trapped, Look for False Breakouts
For those of you who don’t know, false breakout happens when a price breaks either support or resistance, but to only close back in the same range. This is a great time to enter a trade, because you can take advantage of traders who are trapped.
What you want to do is to short the false breakout. You are expecting the trapped traders to cut their trade, which will then further fuel price decline. If you short this break out, it means that you will greatly profit.
Trade with the Trend
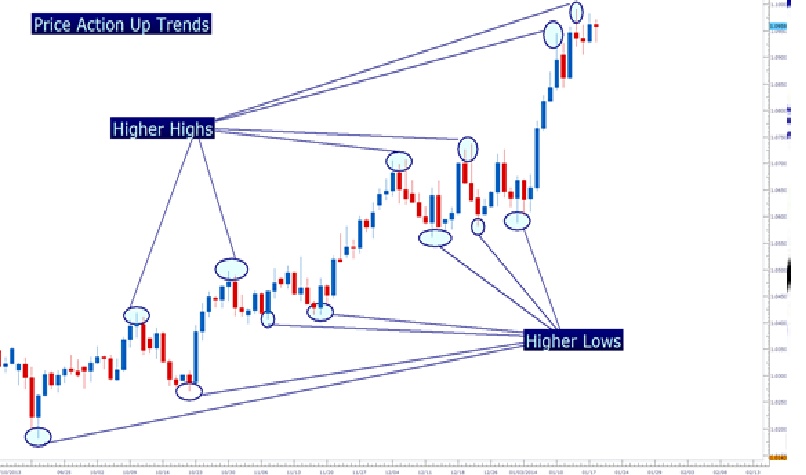
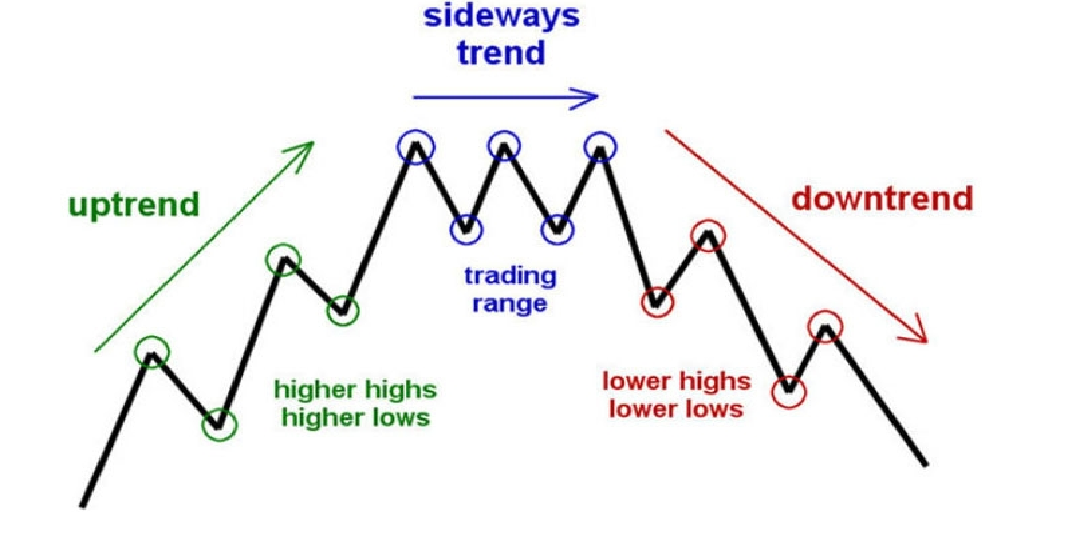
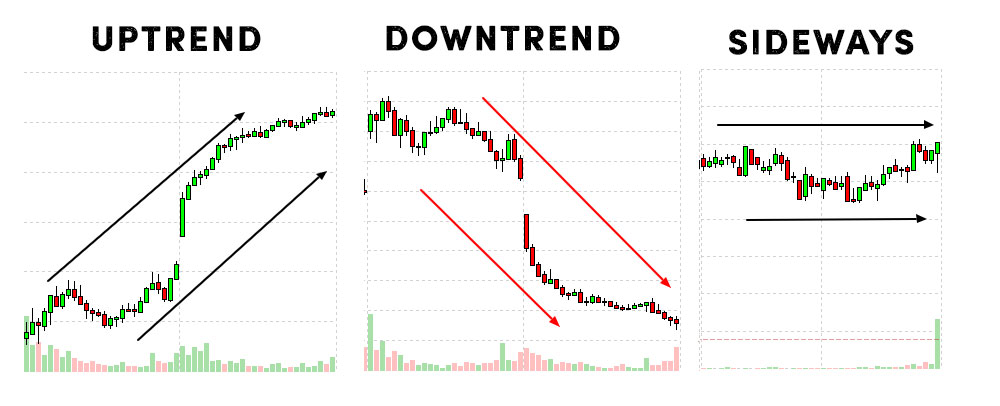
You don’t want to become so obsessed with seeing minor market swings that you miss the major price movements. One of the biggest rules here when it comes to price action trading is that you always want to trade with the trend.
Trading against a trend is not the way to go. When you trade with a trend it greatly improves your profit potential. Of course, this means that you first need to know how to define a trend.
Continuing Patterns and Trending Markets
Continuing or continuation patterns are chart patterns like pennants, triangles, and flags. One of the biggest mistakes that you can make is to trade any of these patterns in a range market. These patterns are best traded in a trending market.
Identifying the End of a Trend
For price action trading, the other important thing that you need to know how to do is to tell when a trend is ending.
What you are looking for here is when a respected moving average is broken, if a trend line is broken, or if the structure is broken. If all three happen at once, you can rest assured that a trend is ending.
CLICK ON IMAGE TO JOIN STOCK TRADING MENTOR BOX

Price Action Trading Tips – Final Thoughts
If you follow the 9 price action trading tips that we have provided you with here today, then your chances of becoming a profitable and successful trader will increase drastically. Price action trading can absolutely help put profits in your pocket, as long as you know what you are doing.
CLICK BELOW TO JOIN INCOME MENTOR BOX AND START MAKING REAL PROFITS!

For more trading tips, strategies, methods, and everything in between, check out Andrew’s Trading Channel. Here you will find the world’s best stock market trading school, a trusted day trading school, state of the art indicators and trading tools, Forex and crypto signals groups, and more!

/figure-1.-eurusd-2-minute-56a22da35f9b58b7d0c78480.jpg)
