A Guide to Bullish Candlestick Patterns

A Guide to Bullish Candlestick Patterns

If you want to start being a consistent and profitable trader, knowing what Candlestick patterns are all about is very important. As far as technical analysis is concerned, candlestick charts are some of the best tools that you have at your disposal. These candlestick patterns are ideal for helping you to identify trends and trend reversals in the market.

What we are here to look at today are very bullish candlestick patterns, and what they mean. In case you didn’t know, candlestick patterns usually form at the end of a trend, and they generally signify the beginning of a new trend. candlestick patterns are formed when one, 2, or more candlesticks form a certain pattern. Even a single candlestick can sometimes be an indication of what is to come.

As far as identifying trend reversals go, being able to read a variety of Candlestick patterns is extremely important period today, we want to look at bullish candlestick patterns, which usually form at the end of a downtrend, and signify that an uptrend is going to happen. Let’s take a closer look at how to read Candlestick charts, as well as what some of the most common bullish candlestick patterns are.

candlestick

How to Read a Candlestick Chart

Candlestick patterns have been used in the western world for trading for well over 100 years at this point, and for good reason. This is in part because they provide you with various pieces of information about a security.

For instance, the four things that a candlestick tells you is what the closing price and the opening price was at, as well as what the highest price and the lowest price traded at was during a day.

In terms of the anatomy of the candlestick, that large or rectangular part is known as the body or the real body of the candle. This indicates the link between the opening price and the closing price for a given day. This body also shows you what the price range is between the opening price and the closing price for any given day.

If you see that the real body of the candle is black, filled in, or red, it indicates that the opening price is higher than the closing price, and this is what is generally known as a bearish candle. It indicates that the price opened high, but the bears then pushed the price down, causing the price to close lower than the opening price.

On the other hand, if you see that the real body of the candle is empty, white, or green, it means that the opening price was lower than the closing price. This is what is known as a bullish candle. This is a strong indication that the price opened, with the bulls then pushing the price upwards, which caused it to close at a higher level than it opened.

Those thin and vertical lines that you see both above and below the real body of a candle is what is known as the Wick or the shadow. This tells you what the lowest and the highest prices for an asset was during a given day. Bullish candles represent strength and they are always green.

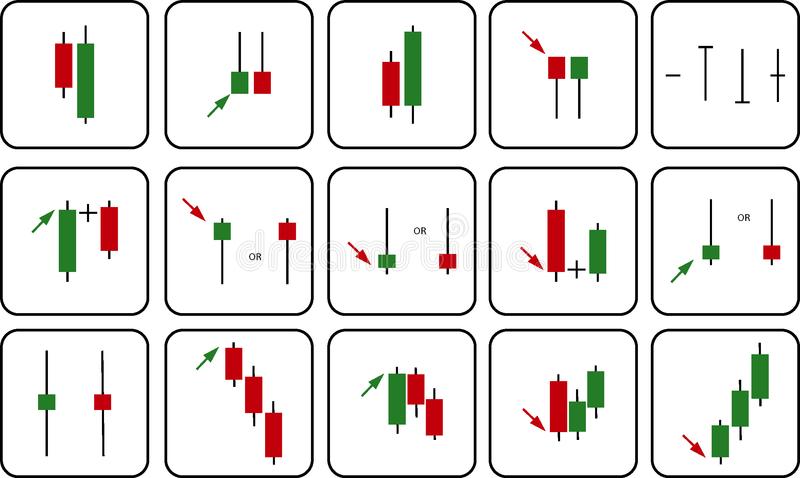
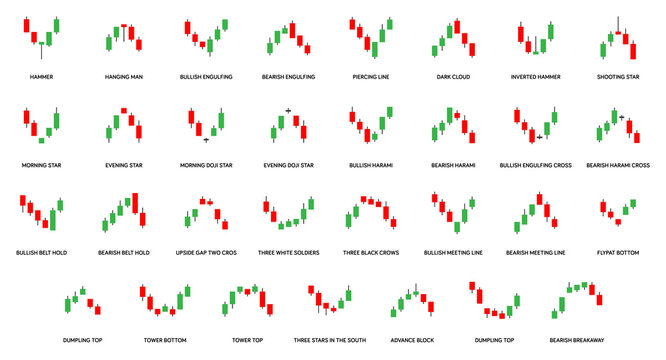
5 Bullish Candlestick Patterns for You To Know

What we want to do right now is to take a closer look at the five most common bullish candlestick patterns that you need to be aware of.

CLICK BELOW TO JOIN INCOME MENTOR BOX AND START MAKING REAL PROFITS! 

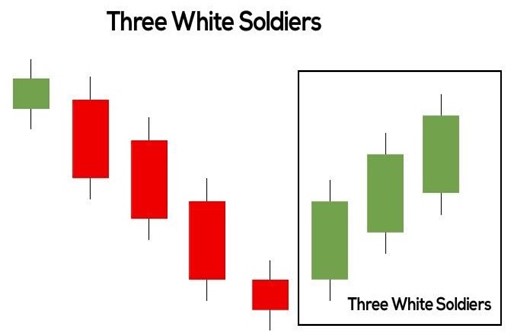
Three White Soldiers

The three white soldiers Candlestick pattern consists of three long bullish candles. These do not have long shadows, or any shadows at all. Each candle opens at least halfway above the open of the previous candle. This is a bullish candlestick pattern that forms at the end of a downtrend and it indicates that a bullish reversal is in the works.
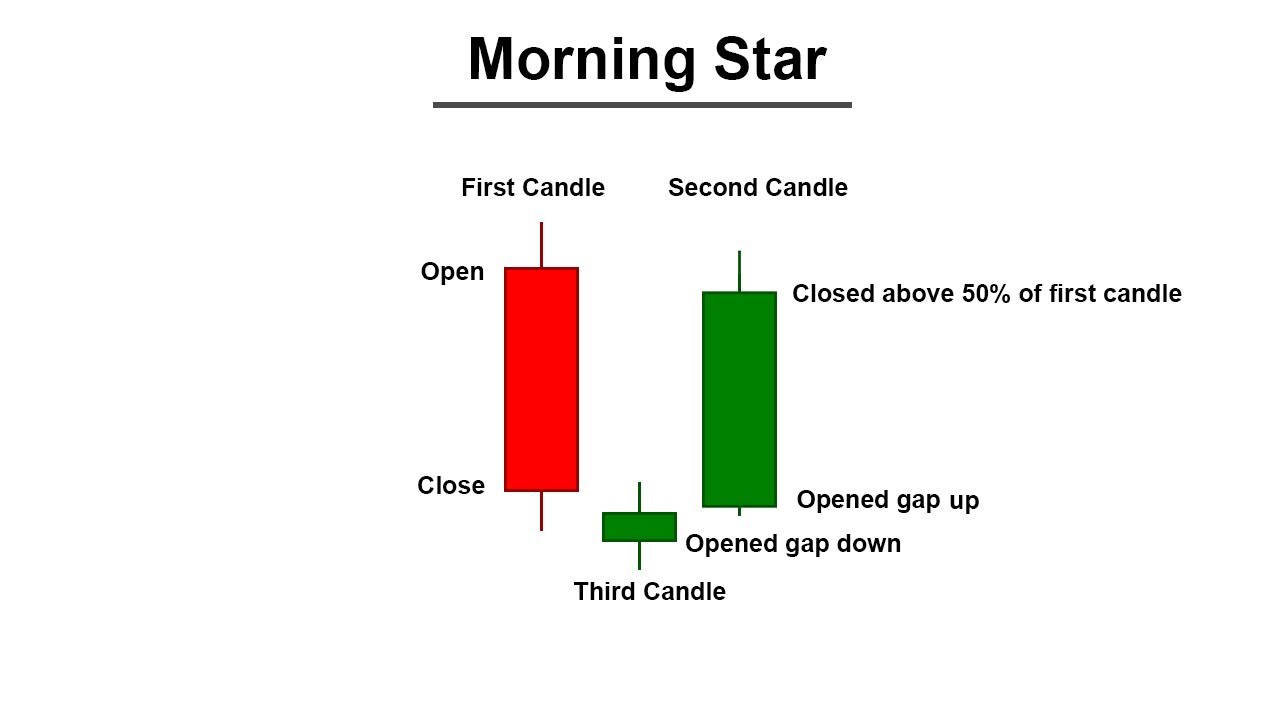
The Morning Star

Another common bullish candlestick pattern that forms at the end of a downtrend is the Morningstar. The Morningstar also consists of three separate candlesticks. The first candlestick is a bearish candle, the second one is a doji candle, and the third is a bullish candle.

The first candle indicates a continuation of a downtrend, the second candle shows indecision in the market, and the third candle is a bullish one that indicates that the bulls are back in power. Keep in mind that the second candle should be completely below both the first and the third candles.
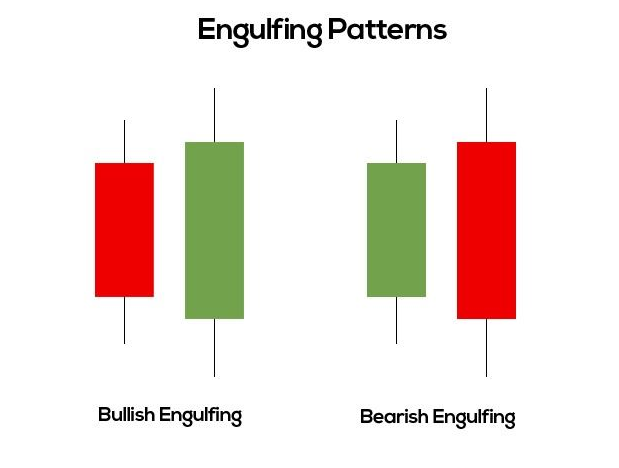
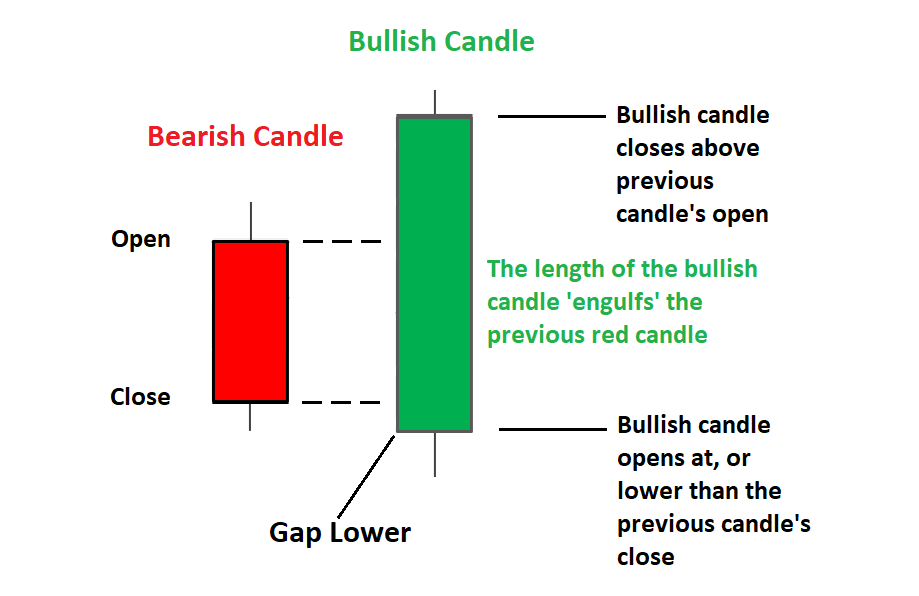
candlestick

Bullish Engulfing

One of the most common bullish candlestick patterns out there is known as bullish engulfing. This is a candlestick pattern that forms at the end of a downtrend and indicates that there is a bullish reversal happening.

This particular pattern consists of two candles, with the second candle completely engulfing the first candle. The first of the two candles is bearish, and it indicates a continuation of a downtrend, but the second candle is a much longer and larger bullish candle that completely engulfs the first one, and signifies that the bulls are back in power.

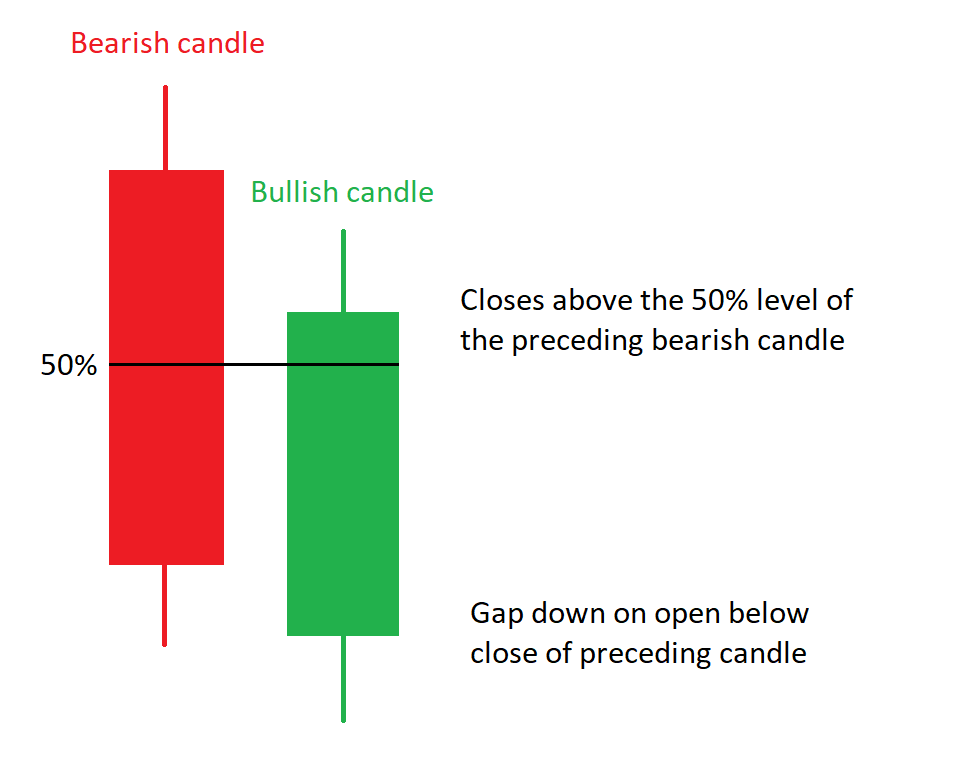
The Piercing Pattern

The 4th bullish candlestick pattern that we want to take a look at is known as the piercing pattern, and it’s also another one that forms at the end of the downtrend. This particular candlestick pattern consists of two separate candles, with the first one being a bearish candle that it signifies a continuation of a downtrend. However, the second candle is a bullish candle, with the gap down closing more than 50% of the real body. This is another strong indication that the bulls are back in power.
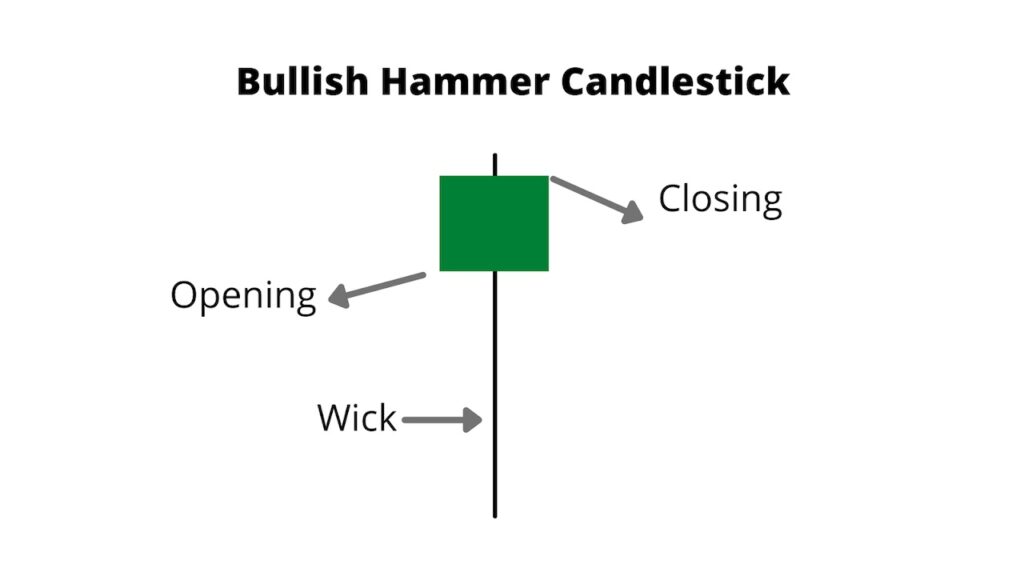
candlestick

The Hammer

The 5th and final bullish candlestick pattern that we want to take a quick look at is known as the hammer. The real body of this candle is very small and is at the top with a lower shadow that should be more than twice the length of the real body.

It also has absolutely no or a very little upper shadow. Here, you can see how the prices open and the sellers then pushed the price down, but the buyers then came back into the market and pushed the price back up, with the result being that the price closed higher than it opened.

candlestick

Bullish Candles – The Bottom Line

The bottom line here is that if you could read candlestick patterns, then you’re one step closer to being your consistent and profitable trader. Today, we’ve covered bullish candlestick patterns, but stay tuned, because we will also be covering bearish candlestick patterns.

CLICK BELOW TO JOIN STOCK TRADING MENTOR BOX

For more trading tips, strategies, methods, and everything in between, check out Andrew’s Trading Channel. Here you will find the world’s best stock market trading school, a trusted day trading school, state of the art indicators and trading tools, Forex and crypto signals groups, and more! 

The Candlestick Patterns Trading Guide

The Candlestick Patterns Trading Guide

If you are just getting into the world of forex trading, then one of the things that you need to know all about are candlestick patterns. Candlestick patterns originated in the country of Japan well over 100 years ago before the western style bar and point-and-figure charts were invented.

In fact, these candlestick patterns were first invented in the 1700s by a Japanese man who saw that there was a link between price and the supply and demand of rice. One of the things that candlestick patterns aim to extrapolate is what the emotions of traders are like. anyway, we will get more into explaining these Candlestick patterns further below.

The point here is that Candlestick patterns are great analysis tools that you can use to place either buy or sell trades, as they show you whether or not there is bullish or bearish momentum in the market. What we are going to do today is to take a closer look at Candlestick patterns and see exactly what they are, how they work, and what the most important ones are that you need to know.

Candlestick Patterns

What are Candlestick Patterns?

In terms of what candlestick patterns actually are, they are at special type of chart that are used by many different traders to determine the possible price movements based on those past patterns. Candlestick patterns are extremely useful for trading because they provide you with a lot of information.

Technically speaking they provide you with four different pieces of information, including the open, that close, the high, and the low of a specific asset throughout a certain period of time like a trader has specified.

Candlestick Chart

The fact of the matter is that trading is more often than not dictated by emotion, even though it shouldn’t be, and this emotion can actually be read in those candlestick patterns. Due to the fact that these Candlestick patterns provide us with such a plethora of information, they are often seen as some of the most useful tools in all of trading.

Now, what can get a bit confusing is being able to identify a variety of Candlestick patterns as well as what they need. as you are about to find out further below, there are many different Candlestick patterns, both bearish and bullish comment and they all tell you something different. The trick is of course to be able to read these patterns and to therefore place trades based on what those patterns tell you.

The Components of Candlesticks

Something else that is definitely important for you to know here is what the different components of candlesticks are. So, once again, candlestick patterns show you the markets open, the high, low, and the closing price for the day. Now, a candlestick has a wide part, which is called the real body.

The real body represents the range of price between the open and the close for the day of trading. If this real body is filled in or totally black, it indicates that the close was lower than the open. However, if the real body is empty that means that the close was higher than the open. Moreover, the wicks of the candles indicate the low price of the day and the high price of the day.

What you need to know here is that when it comes to forex, stock market, commodities trading, and more, the fact of the matter is that these candlestick charts do provide you with more or less the same information as bar charts, but most people find that candlestick patterns are much easier to read than bar charts. In terms of identifying the candles, do keep in mind that most people will shade a down candle red instead of black, and up candles are often shaded green as opposed to white.

Candlestick Patterns

Pros & Cons of Candlestick Charts

Just like everything in trading, Candlestick charts do have both their pros and cons, so let’s take a look.

Pros

  • One big advantage is that most indicators work really well with this type of chart.
  • Candlestick patterns are very aesthetically pleasing and they’re easy to read. this is a very beginner friendly way of trading.
  • What also stands out is that candlestick charts are infinitely customizable, and a single candlestick can represent anytime period of any asset.
  • Candlestick patterns are also extremely accurate because they provide you with so many different types of information, including the highs, lows, opens, and closes inside a given time frame.
  • This is one of the best possible tools for identifying market sentiment and who is in control of the market.

Cons

  • One small disadvantage here is that candlestick charts do sometimes have gaps in them where one candle closes at a certain level but the following candle opens at a different level.
  • These patterns do also have a tendency to cause what is called apophenia, which is a cognitive bias where we see patterns and things that are actually random. Some people may actually see patterns where none exist.
  • Many people make the mistake of thinking that candlestick patterns are all that they need in order to trade accurately. The fact of the matter is that price data alone usually isn’t enough to provide you with enough reliable information to place trades. In other words, do so you have to use indicators.

VISIT ANDREW’S TRADING CHANNEL

Some Basic Candlestick Patterns

What we want to do now is to go over some of the most basic Candlestick patterns out there, and exactly what they needed. Remember folks, the trick to candlestick trading is that you actually need to be able to identify the various patterns that you may see within your charts.

Candlestick Patterns

Bearish Engulfing Pattern

One of the most basic Candlesticks that you may see is called the bearish engulfing pattern. The type of pattern that develops in an uptrend when there are more sellers than buyers. In this pattern, you will see a long red real body that engulfs a smaller green real body. This is a pattern that indicates that the sellers are back in control and the price could continue its decline.

Bullish Engulfing Pattern

On the other hand, we have the bullish engulfing pattern, which is when the buyers outnumber the sellers. In terms of the candlestick pattern, you will see a long green real body that engulfs a small red real body. This shows that the bulls have established a certain amount of control, and the price could continue to go up.

Candlestick Patterns – The Bottom Line

Today, we have provided you with a basic tutorial on candlesticks, but the fact of the matter is that there are of course dozens, if not hundreds of different patterns out there. Stay tuned and come back tomorrow, because we will be doing a part 2, where we will be talking about all of the most common candlestick patterns that you may encounter, and exactly what they mean.

If you need help day trading, and what you need is a comprehensive education, particularly on Forex trading, then the best place to be is the Income Mentor Box Day Trading Academy. At this time, the IMB Academy is the most comprehensive, user friendly, effective, and affordable Forex trading school out there.  

CLICK BELOW TO JOIN INCOME MENTOR BOX AND START MAKING REAL PROFITS!