Using the Stochastic Oscillator the Right Way

Using the Stochastic Oscillator the Right Way

If you are just getting into the world of Forex trading, then there are quite a few important things that you need to know. Now, when it comes to being able to find the best possible trades, what you need to know all about are indicators. What we are here to talk about today is the Stochastic indicator, otherwise known as the stochastic oscillator.

When it comes down to it, this stochastic indicator is hands down on the best indicators that you can use. This indicator can actually be used in multiple ways. Now, the problem with the stochastic oscillator is that many people just don’t know how to use it. Today, we are here to help solve this problem.

What we are here to do today is to take a closer look at one of Andrew’s most popular trading guides on Andrew’s Trading Channel. Today’s article is going to feature a combination of stochastic oscillator tips that Andrew provides in his video, as well as some of the most basic and important info that you need to know about it. Let’s get right to it and explain what the stochastic oscillator is, and how to use it the right way.

What is the Stochastic Indicator?

First and foremost, the stochastic indicator is a type of momentum indicator. In other words, this indicator provides you with valuable information about the strength of a certain trend. This is a type of indicator that was first developed in the 1950s by a man named George Lane.

Technically speaking, this indicator measures the relationship between an asset’s closing price and its price range over a specific period of time. The fact of the matter is that to this day, the stochastic oscillator is by far one of the most popular momentum indicators out there.

The reason for this is because it is very easy to read and to use, plus it is also very accurate in terms of indicating whether you should place a buy trade or a sell trade. Therefore, it is in part also a trend indicator, because after all, if an indicator tells you how strong a trend is, then it also tells you whether or not there is a trend in the first place.

What Does it Tell You?

Let’s provide you with some more detailed information on how exactly this stochastic oscillator works and what it tells you. One of the most important things to note here is that this indicator is range bound. The value it will show you is always going to be between 0 and 100. One of the best things about it is that it is ideal for telling you if a security is overbought or oversold.

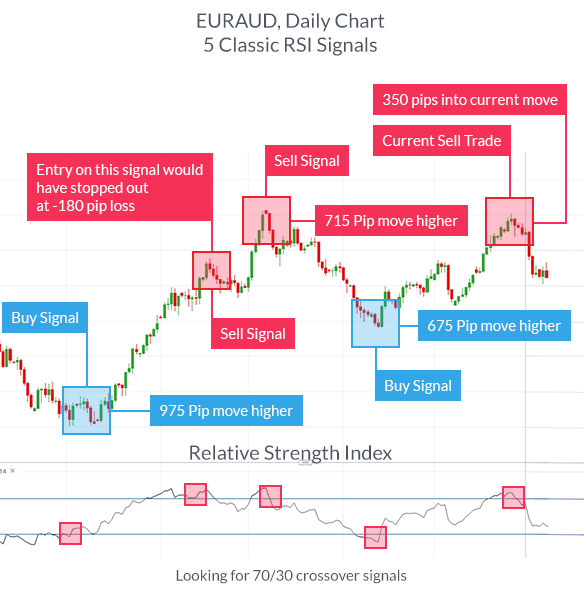
Generally speaking, if the reading is at 80 or over, it indicates that something is overbought. If the stochastic indicator provides you with a value of 20 or below, it indicates that a security is oversold. Although this is a good indication of the momentum of a trend, it’s not always 100%. Securities can sometimes remain overbought or oversold, while also continuing with the same trend.

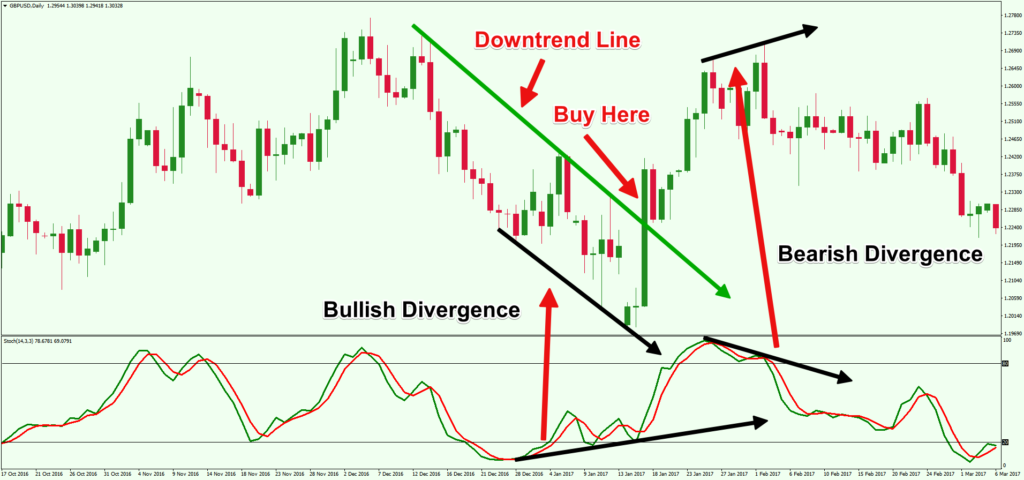
Another big benefit of this particular indicator is that it is much easier to see hidden divergences with it than with most other indicators. The other important thing to know here is that charting the stochastic oscillator usually consists of two lines. One line is the realtime value of the oscillator, while the second line represents the three day simple moving average. Now, the most important thing to know is that when these two lines cross, it signals that there is a trend reversal on the horizon.

Calculating the Stochastic Oscillator

Something else that you need to know in order to actually put this indicator to use, is how to calculate it. The formula for this indicator is as follows.

Stochastic Oscillator

Here, C represents the most recent closing price, L14 represents the lowest trading price in the last 14 days, H14 represents the highest price traded at over the last 14 days, and %K represents the current value of the stochastic indicator.

Drawbacks

The stochastic oscillator does have a couple of drawbacks that you certainly need to know about, so let’s take a quick look at these.

One of the drawbacks here is that it may sometimes produce false signals. In other words, it may tell you that there is a reversal on the horizon, when this is actually not the case at all, which can therefore lead to a losing trade. If a market is very volatile, the chances of this occurring are fairly high.

In order to combat this issue, one good thing that you can do is to use the price trend as a filter. In other words, if signals from your stochastic oscillator go in the same direction as a trend, then it is generally a safe trade. Also keep in mind that this indicator is not the best to use in a sideways trending market.

VISIT ANDREW’S TRADING CHANNEL

Tips for Success When Using the Stochastic Oscillator

Right now, we want to finish things off by providing you with some of the most important tips for success to follow when trading with the Stochastic oscillator.

  • When trading with the stochastic oscillator, one of the most important things to keep in mind is that if you use lower settings, it will generally provide you with more signals.
  • The next most important tip to follow here is that when using the stochastic indicator on your chart, the best settings to use are usually the default settings, which are 14, 3, and 3.
  • What you also need to realize here is that if the market is trending strongly, you really want to use a pattern trading strategy for the best chances of success.

Stochastic Oscillator

Using the Stochastic Indicator – Final Thoughts

When all has been said and done, we definitely recommend watching full video that Andrew has uploaded about the correct way to use the stochastic indicator. The bottom line is that this is an excellent momentum indicator that you should absolutely master.

If you need help day trading, and what you need is a comprehensive education, particularly on Forex trading, then the best place to be is the Income Mentor Box Day Trading Academy. At this time, the IMB Academy is the most comprehensive, user friendly, effective, and affordable Forex trading school out there.  

CLICK BELOW TO JOIN INCOME MENTOR BOX AND START MAKING REAL PROFITS! 

The Best Day Trading Indicators

The Best Day Trading Indicators

If you are just getting into the world of trading, whether Forex, cryptocurrencies, or otherwise, something that you definitely need to know all about are trading indicators. In case you have no idea what trading indicators are no worries because we will explain this in great detail below. However, with that being said, what you need to know here is that day trading indicators are important tools that provide you with crucial information that will determine exactly how and when you trade.

The bottom line is that without good day trading indicators, you just aren’t going to make any money and you aren’t going to be successful at all. Today we’re here to do a bit of a guide for newbies in terms of day trading indicators, we’re going to talk about what exactly day trading is, what indicators are, what indicators tell you, and what the best day trading indicators out there are. Let’s get right to it.


Trading Indicators

What is Day Trading?

Before we start talking about day trading indicators, it’s probably a good idea for you to get a basic definition of what actual day trading is. Now first and foremost, day trading is most often characterized by large degree of technical analysis, and it requires a lot of self discipline and objectivity. Now, day trading usually refers to a practice of buying and selling a specific security in a single day.

Therefore it can also be known as intraday trading as it all happens over the span of one day. For the most part, day traders will utilize a lot of leverage as well as a variety of short term trading strategies to capitalize on even the smallest of price movements that occur in extremely liquid currencies and stock markets.


What are Indicators?

OK, so now that you know what day trading is, it’s a good idea for you to get a basic definition of what a day trading indicator is. So the most basic definition of an indicator is a tool or set of tools that is applied to a trading chart that can help to make the market more clear.

The main purpose of indicators are to provide you with a certain set of information, such as when an asset is overbought or oversold, what the market trend is like, and more.

Moreover, trading indicators are mathematical calculations that are plotted as lines on a price chart and it helps traded to identify certain signals or trades that can be placed. Indicators usually refer to a technical chart pattern that is derived from the price, volume, or the open interest of a given asset. Of course there are many different types of indicators that tell you different things.

Trading Indicators


What do Day Trading Indicators Tell Us?

As mentioned above, day trading indicators are designed to provide you with a variety of facts about a certain security or asset. So what exactly do trading indicators tell you? When it comes down to it, there are four main pieces of information that you can gleam from any great day. Trading indicator.


The Trend

The first thing that a trading indicator might tell you is the trend of the market, or in other words, in what direction the market is moving. Generally speaking, trend indicators are also known as also oscillators, as they usually move up and down between highs and lows.

Volume

The second type of day trading indicator out there is the volume indicator and these change with time. his type of indicator indicates the number of stocks that are being bought or sold over a specific amount of time. When the price of a security or asset changes, the volume indicator will indicate how strong that move is.

Momentum

The third thing that indicators might tell you is what the momentum of an asset is like. Or in other words, momentum indicators tell you the strength of a certain trend. Momentum indicators will also signal if reversal is in the near future.

Volatility

The fourth type of indicator out there is the volatility indicator, which is in fact one of the most important ones of all, as it indicates how much a price changes over a given. If there is high volatility means there are big price moves.

The Best Day Trading Indicators

Now that we know what day trading indicators are and what they can tell you, let’s take a quick look at the very best intraday trading indicators out there.

Bollinger Bands

The Bollinger Bands indicator is a volatility indicator that tells you how volatile a market is. When the market is moving and volatility is high, the bands widen and increase the gap between them, and the gap between bands is small when volatility is low.

Moving Averages

Moving averages are intraday trading indicators that provide you with useful information about the momentum of a market trends and trend reversals, as well as stop loss and stop loss points. Moving averages are all about allowing traders to find opportunities in the direction of the current trend.

Commodity Channel Index

The Commodity Channel Index or CCI allows you traders to identify new and emerging market trends. This indicator provides you with values ranging from negative 100 to positive 100 an if the value is positive in indicates an up trade and if the value is negative, it indicates a downtrend.

Relative Strength Index

The relative strength index, or RSI for short, is another momentum indicator that features a single line that ranges from zero to 100. This indicates if a stock is overbought or oversold, and if the reading is above 70 it indicates that a security is overbought and if it is below 30 it is oversold.

Stochastic Oscillator

This is another fantastic day trading momentum indicator that provides you with information about the closing price of a stock, with a range of prices over a certain period of time.


The Best Trading Indicators – Final Thoughts

There you have it folks, all of the information that you need about the best day trading indicators out there to get started.

Remember folks, if you need help day trading, and what you need is a comprehensive education, particularly on Forex trading, then the best place to be is the Income Mentor Box Day Trading Academy. At this time, the IMB Academy is the most comprehensive, user friendly, effective, and affordable Forex trading school out there.  

CLICK BELOW TO JOIN INCOME MENTOR BOX AND START MAKING REAL PROFITS!